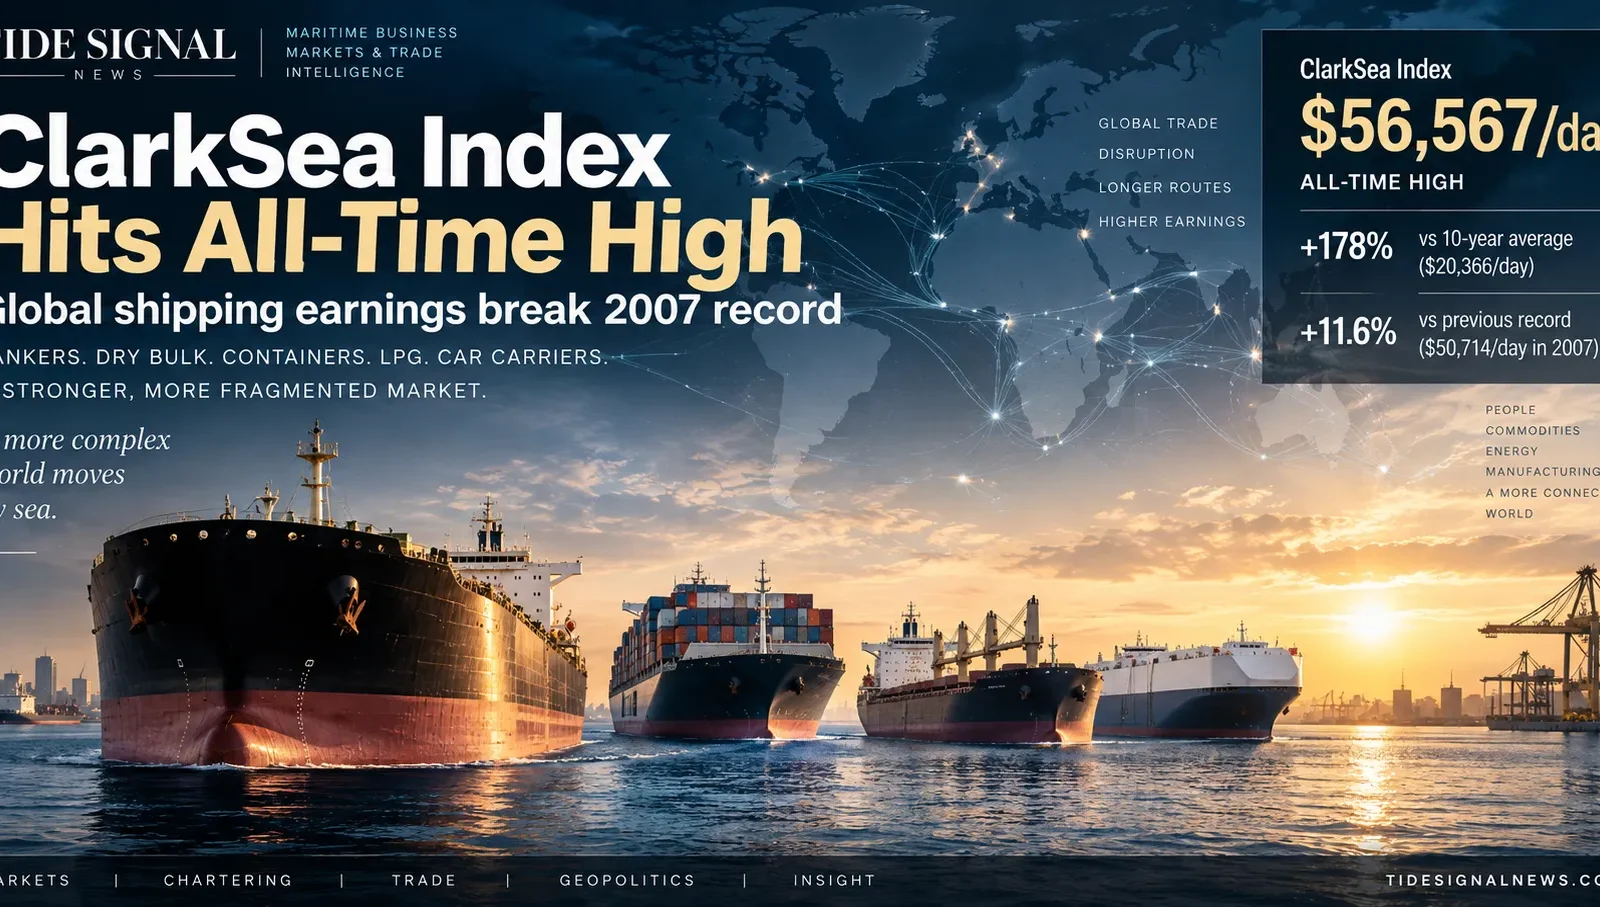
The ClarkSea Index has climbed to an all-time high of $56,567 per day, pushing global shipping earnings beyond the previous pre-2026 record set in December 2007. The move is being led by extraordinary tanker markets, but the significance is broader: dry bulk earnings are also at multi-year highs, while containership, LPG and car-carrier markets remain historically firm.
That makes the latest ClarkSea Index reading more than a tanker headline. It is a cross-sector signal that the economics of merchant shipping have entered one of the strongest periods in the modern history of the index.
Clarksons Research’s cross-sector earnings benchmark is now around 178% above its 10-year average of $20,366 per day. It has also exceeded the previous pre-2026 high of $50,714 per day, recorded in December 2007, and the $53,190 per day level reached during the first major phase of the 2026 US–Iran conflict.
Source: Clarksons Research data cited in current market reporting. The ClarkSea Index is a weighted cross-sector earnings benchmark and should not be read as the earnings of a single “average ship”.
ClarkSea Index Hits $56,567/Day: Why the New Record Matters
The ClarkSea Index is designed to provide a broad measure of shipping earnings across the main merchant vessel sectors.
It is not a freight index for one route, one cargo or one ship type. Instead, it combines earnings benchmarks from major shipping segments using fleet-based weightings.
That matters because individual freight markets can produce spectacular numbers without the wider industry being equally strong.
A VLCC spike alone, for example, can make tanker headlines look extraordinary while dry bulk, containers or gas shipping remain weak.
The current reading is different.
Tankers are doing much of the heavy lifting, but the strength is broad enough across other sectors to push the entire ClarkSea benchmark above every previous historical peak.
What Is the ClarkSea Index?
The ClarkSea Index is Clarksons Research’s cross-sector measure of vessel earnings.
Clarksons describes it as a weighted average covering the main commercial vessel types, with weighting based on the number of vessels in each fleet sector.
The benchmark is useful because shipping does not have a single universal freight rate.
A crude tanker earns differently from a Capesize bulker. A containership is priced differently from an LPG carrier. A car carrier operates under a different charter structure again.
The ClarkSea Index provides a common earnings barometer across those markets.
| ClarkSea reference | Level | What it tells the market |
|---|---|---|
| Current record | $56,567/day | Highest reported cross-sector reading on record. |
| March 2026 spike | $53,190/day | Earlier US–Iran war-driven market peak. |
| Previous pre-2026 record | $50,714/day | December 2007 shipping-boom peak. |
| 10-year average | $20,366/day | Shows how far current earnings sit above the recent structural norm. |
| 2025 annual average | $26,836/day | Already a strong year before the 2026 escalation. |
Clarksons’ 2025 results presentation put the index’s 10-year average at $20,366 per day and the 2025 annual average at $26,836 per day.
That means the current $56,567 figure is not simply marginally above trend.
It is almost 2.8 times the 10-year average.
Why the ClarkSea Index Is Breaking Records in 2026
The current record is the product of several overlapping forces rather than one simple demand boom.
1. Tanker earnings have become extreme
The crude tanker market is the most obvious driver.
VLCC benchmarks have moved to levels that would once have been viewed as almost impossible outside an extreme disruption.
Tide Signal has already tracked that repricing through the record Gulf of Oman–China VLCC market, the $25 million Iraqi crude VLCC voyage and the latest surge in VLCC asset values.
The same shock has now moved beyond freight and into ship prices, period charters and strategic fleet acquisitions.
That tanker strength has a disproportionately large effect on the ClarkSea Index because the earnings gains are so large.
2. Clean tanker markets are also exceptionally strong
The crude tanker boom is not operating in isolation.
Tide Signal’s latest clean tanker rates analysis showed TC1 Middle East Gulf–Japan at WS785 with an indicative Baltic round-trip TCE of around $232,000 per day.
That matters because it demonstrates that the energy-shipping shock is affecting multiple tanker classes and cargo types.
LR2, LR1 and MR product-tanker markets are being repriced by the same combination of route risk, vessel positioning, insurance constraints and reduced effective supply.
3. Dry bulk is also contributing
Dry bulk is not producing tanker-style seven-figure headlines, but earnings remain strong by recent standards.
Recent Baltic readings have placed the BDI above 3,500 points, with Capesize earnings around the $50,000-per-day area.
That is important because the ClarkSea record would be less meaningful if it depended entirely on one extraordinary tanker route.
Instead, stronger bulk markets provide another layer of support.
4. Container shipping remains historically firm
Container shipping is no longer at the pandemic-era extremes seen in 2021–22, but earnings and charter markets remain elevated relative to long-run norms in several trades.
Route disruption has repeatedly reduced effective capacity by increasing sailing distances and creating network inefficiency.
The return of selected services to Suez does not instantly remove that support. Tide Signal’s analysis of the return of Asia–Europe services through the Suez Canal showed how the transition itself can create vessel bunching, berth pressure and network disruption.
5. LPG and car carriers remain strong
Specialised shipping markets also remain supportive.
Vehicle carriers in particular have benefited from the continued expansion of Chinese automobile exports.
Tide Signal’s China car-export and vehicle-carrier analysis showed modern PCTC charter rates strengthening again as exports absorb capacity faster than many expected.
That means the ClarkSea record is not just “VLCCs plus everything else”.
Several major shipping sectors are simultaneously operating above long-term earnings norms.
This Is Not the Same Shipping Boom as 2007
The comparison with 2007 is useful, but it can also be misleading.
The last great pre-financial-crisis shipping boom was powered heavily by rapid globalisation, Chinese industrialisation, commodity demand and extremely tight physical fleet supply.
The 2026 environment has a different structure.
Today’s market is being supported not only by cargo demand but by inefficiency.
Ships are spending more time:
- sailing longer routes;
- waiting for safe access;
- repositioning between disrupted basins;
- avoiding high-risk areas;
- absorbing insurance and compliance restrictions;
- operating below theoretical network efficiency; and
- serving trade flows that have been geographically rearranged by sanctions and conflict.
That distinction is fundamental.
Shipping can earn more even when world trade volumes are not booming at 2000s-style rates if the same tonne of cargo has to travel farther, wait longer or use a smaller pool of commercially acceptable vessels.
The 2007 boom was largely a story of demand outrunning ships. The 2026 boom is increasingly a story of disruption reducing the productivity of the ships that already exist.
That makes the current record both powerful and fragile. The earnings are real, but part of the scarcity is created by geopolitics, rerouting, insurance and commercial restrictions rather than permanent removal of fleet capacity.
The Difference Between Fleet Supply and Effective Fleet Supply
The current cycle repeatedly demonstrates one of the most important concepts in shipping economics:
the number of ships in the global fleet is not the same thing as the number of ships available for a cargo.
A vessel can exist physically and still be unavailable because:
- it is in the wrong basin;
- its owner rejects the route;
- the insurer will not accept the exposure;
- the charterer cannot clear the ownership chain;
- the ship is committed under period employment;
- the vessel is delayed by congestion;
- the route requires longer sailing distance;
- the ship is unsuitable for a terminal or cargo; or
- the owner has a more profitable alternative fixture.
This is how effective fleet supply can tighten even while the global fleet continues to grow.
It is also why freight can rise much faster than world trade.
Hormuz Has Become a Global Shipping-Earnings Multiplier
The Strait of Hormuz has become one of the largest sources of inefficiency in the current shipping market.
Tide Signal’s Hormuz shipping analysis has tracked the collapse in normal transit patterns, the shrinking pool of willing tanker owners and the additional sanctions and compliance friction surrounding regional voyages.
Those effects extend far beyond the vessels physically inside the Gulf.
If one tanker spends longer waiting, another vessel may need to cover its next cargo.
If an owner refuses the Gulf, a charterer must compete for a smaller pool of acceptable ships.
If cargo shifts to another origin, tonne-mile demand can rise.
If insurance becomes more restrictive, effective supply tightens further.
Each of those effects can raise freight without increasing global cargo volume.
War Risk Is Now Part of the Shipping Supply Curve
Insurance is another reason the ClarkSea Index can rise during geopolitical stress.
Tide Signal’s war-risk premiums guide explains how risk is transmitted through voyage economics, owner approval, charterparty negotiations and freight.
The key market effect is behavioural.
War risk does not need to make a route impossible.
It only needs to make enough owners unwilling to perform it.
Once that happens, the owners who remain willing gain pricing power.
Why Strong Shipping Earnings Do Not Mean Every Shipowner Is Making Record Profits
The ClarkSea Index is a market benchmark, not a profit-and-loss statement.
Strong headline earnings can coexist with very different net outcomes between owners.
Actual cash generation depends on:
- charter coverage;
- spot-market exposure;
- vessel age and efficiency;
- debt cost;
- operating expenses;
- bunker exposure;
- insurance;
- crew costs;
- drydock and survey timing;
- commercial management;
- commissions;
- off-hire; and
- the owner’s ability to position ships into the strongest markets.
A company with ships locked into older time charters may capture little of a sudden spot spike.
An owner with prompt, uncommitted tonnage in the correct basin may capture much more.
ClarkSea Index vs Baltic Dry Index: They Measure Different Things
The ClarkSea Index should not be confused with the Baltic Dry Index.
The Baltic Dry Index is focused on dry-bulk freight across major vessel classes.
The ClarkSea Index is a broader cross-sector earnings benchmark.
| Benchmark | Main coverage | Best use |
|---|---|---|
| ClarkSea Index | Cross-sector vessel earnings | Broad health of merchant-shipping earnings |
| Baltic Dry Index | Dry-bulk freight | Dry-bulk market direction |
| Worldscale | Tanker voyage freight | Comparing tanker freight on specific routes |
For tanker readers, Tide Signal’s Worldscale explainer covers the freight system used across many crude and product-tanker routes.
Why the ClarkSea Record Matters for Ship Values
Higher earnings eventually influence asset values.
A ship is fundamentally a machine for producing future cash flow.
If expected earnings rise, buyers may be willing to pay more for the asset.
That mechanism is already clearly visible in crude tankers.
Tide Signal’s VLCC asset-value analysis showed current broker indications placing 10-year-old VLCCs above newbuilding prices.
The unusual relationship is partly explained by the current ClarkSea environment: immediate access to extraordinary freight has become sufficiently valuable to outweigh the normal age discount on prompt secondhand tonnage.
Why the Record Matters for Newbuilding Decisions
Strong shipping earnings normally support new orders.
But ordering into a record market is one of the oldest risks in shipping.
The vessel earning exceptional rates today may not deliver from the shipyard until years later.
Owners therefore need to separate:
- the current spot market;
- the expected multi-year freight cycle;
- the vessel orderbook;
- shipyard delivery timing;
- financing cost;
- future environmental regulation; and
- the residual value of the vessel at the end of the cycle.
High ClarkSea readings can improve confidence and access to capital, but they can also tempt owners to order ships at precisely the point when the market appears strongest.
Why the Record Matters for Charterers
For charterers, a rising ClarkSea Index is essentially a signal that transport capacity is becoming more expensive across multiple sectors.
That can affect:
- commodity arbitrage;
- delivered energy costs;
- inventory strategy;
- cargo timing;
- contract-of-affreightment pricing;
- period-charter decisions;
- route selection; and
- the economics of sourcing cargo from farther away.
When freight is expensive in one sector, charterers can sometimes substitute route, origin, vessel size or contract structure.
When several sectors are simultaneously firm, the flexibility becomes more expensive.
The 2007 Comparison: Similar Number, Different Market
The previous $50,714-per-day ClarkSea peak came in December 2007.
Clarksons’ historical analysis described the period as an exceptionally tight shipping environment, with very strong tanker and dry-bulk conditions.
Today’s record is numerically higher, but the underlying world is different.
In 2007:
- China-led industrialisation was a dominant demand engine;
- globalisation was expanding rapidly;
- commodity trade growth was extremely strong; and
- physical fleet shortages played a central role.
In 2026:
- geopolitical conflict is extending voyages;
- sanctions are fragmenting fleets;
- insurance is influencing vessel availability;
- chokepoint disruption is reducing network efficiency;
- state-owned buyers are securing strategic tonnage; and
- route choice can matter as much as underlying cargo growth.
The result can look similar in an index.
The economics producing that result are not identical.
The ClarkSea Index Is Also a Measure of Shipping Complexity
This is perhaps the most important interpretation of the new record.
Modern shipping earns money by moving trade efficiently.
But it can also earn more when the world becomes less efficient.
A longer voyage consumes more vessel days.
A closed route consumes more capacity.
A sanctions restriction splits one global fleet into separate commercially acceptable pools.
A war-risk exclusion makes some owners withdraw.
A port delay increases the number of ships required to move the same annual cargo volume.
That means a high ClarkSea Index can simultaneously indicate:
- strong demand for shipping services;
- tight effective fleet supply;
- high operational friction;
- significant geopolitical disruption; and
- poor efficiency in the underlying trade network.
For shipowners, that complexity can generate extraordinary earnings.
For cargo owners and the wider economy, it can represent a major logistics cost.
The ClarkSea record is not simply evidence that shipping is booming. It is evidence that the world is consuming an extraordinary amount of shipping capacity to move trade through an increasingly inefficient system.
That distinction matters because disruption-driven earnings can remain extremely high while the underlying catalyst is temporary. The market is strongest precisely because normal shipping has become harder.
Can the ClarkSea Index Stay Above $50,000/Day?
It can, but sustaining that level would require continued support from several sectors at the same time.
The most important variables are:
Middle East tanker disruption
If Hormuz restrictions, insurance constraints and owner reluctance persist, tanker earnings can remain a major source of support.
Dry-bulk strength
Strong Capesize and Panamax markets would make the index less dependent on tankers alone.
Container-network inefficiency
Suez and Red Sea routing will continue to influence effective containership capacity.
Specialised shipping
Firm LPG and car-carrier markets provide additional cross-sector support.
Fleet growth
Large newbuilding deliveries can eventually reduce scarcity if cargo demand and tonne-mile growth fail to absorb them.
Geopolitical de-escalation
A durable improvement in key chokepoints could release effective capacity quickly and compress freight.
What Could Bring the ClarkSea Index Down?
The same mechanism that pushed the index higher could work in reverse.
The ClarkSea Index could fall sharply if:
- Hormuz traffic normalises;
- war-risk premiums retreat;
- more tanker owners re-enter Gulf trades;
- Suez and Red Sea routes normalise without major congestion;
- newbuilding deliveries increase effective supply;
- Chinese commodity demand weakens;
- oil production or exports decline;
- vehicle-export growth slows; or
- global economic growth deteriorates enough to reduce cargo demand.
That asymmetry is important for investors and shipowners.
The index may be at a record, but part of the premium is attached to conditions that can change faster than the fleet itself.
What Shipowners Should Watch Next
- VLCC and Suezmax earnings: the largest immediate driver of the current record.
- Clean tanker benchmarks: confirmation of whether energy-shipping strength remains broad.
- Capesize earnings: an important test of whether dry bulk continues supporting the cross-sector index.
- Suez normalisation: faster route restoration can release container capacity but may create temporary bunching.
- War-risk pricing: insurance can change owner behaviour before freight indices react.
- Secondhand ship values: asset prices show whether owners believe high earnings will persist.
- Newbuilding orders: a rapid ordering response could create the supply problem of the next cycle.
ClarkSea Index FAQ
What is the ClarkSea Index?
The ClarkSea Index is a Clarksons Research cross-sector vessel-earnings benchmark. It combines earnings from major merchant-shipping sectors using fleet-based weightings to provide a broad view of shipping-market conditions.
What is the ClarkSea Index today?
The latest reported reading on 15 September 2026 is $56,567 per day, an all-time high.
Is $56,567/day the earnings of an average ship?
No. The ClarkSea Index is a weighted market benchmark across shipping sectors. It should not be interpreted as the actual daily profit or charter rate of one average vessel.
What was the previous ClarkSea Index record?
The previous pre-2026 record was $50,714 per day in December 2007. The index also reached approximately $53,190 per day during the first major US–Iran conflict spike in March 2026.
What is the 10-year average ClarkSea Index?
Clarksons’ 2025 full-year results presentation placed the 10-year average at $20,366 per day.
Why is the ClarkSea Index so high?
The current record is being driven heavily by exceptional tanker earnings, with additional support from strong dry bulk and historically firm container, LPG and car-carrier markets. Geopolitical disruption is also reducing effective vessel supply.
What is the difference between the ClarkSea Index and the Baltic Dry Index?
The Baltic Dry Index measures dry-bulk freight conditions. The ClarkSea Index is broader and tracks earnings across multiple merchant-shipping sectors.
Does a high ClarkSea Index mean shipping companies are highly profitable?
Not automatically. Actual profitability depends on charter coverage, debt, operating costs, vessel efficiency, insurance, off-hire, bunker exposure and how much of the owner’s fleet is exposed to the strongest spot markets.
Could the ClarkSea Index fall quickly?
Yes. If geopolitical disruption eases and effective vessel supply returns to the market, freight and earnings can correct faster than physical fleet capacity changes.
Sources and Further Reading
- Splash — ClarkSea Index reaches $56,567/day as shipping markets break historical benchmarks
- Clarksons — 2025 full-year results: ClarkSea 10-year average and historical annual earnings
- Clarksons Research — Historical ClarkSea record analysis and the 2007 benchmark
- Seatrade Maritime — 2026 shipping-market strength and global orderbook context
- Lloyd’s List — Shipping earnings, disruption and market resilience