Markets · Container Shipping · Transpacific
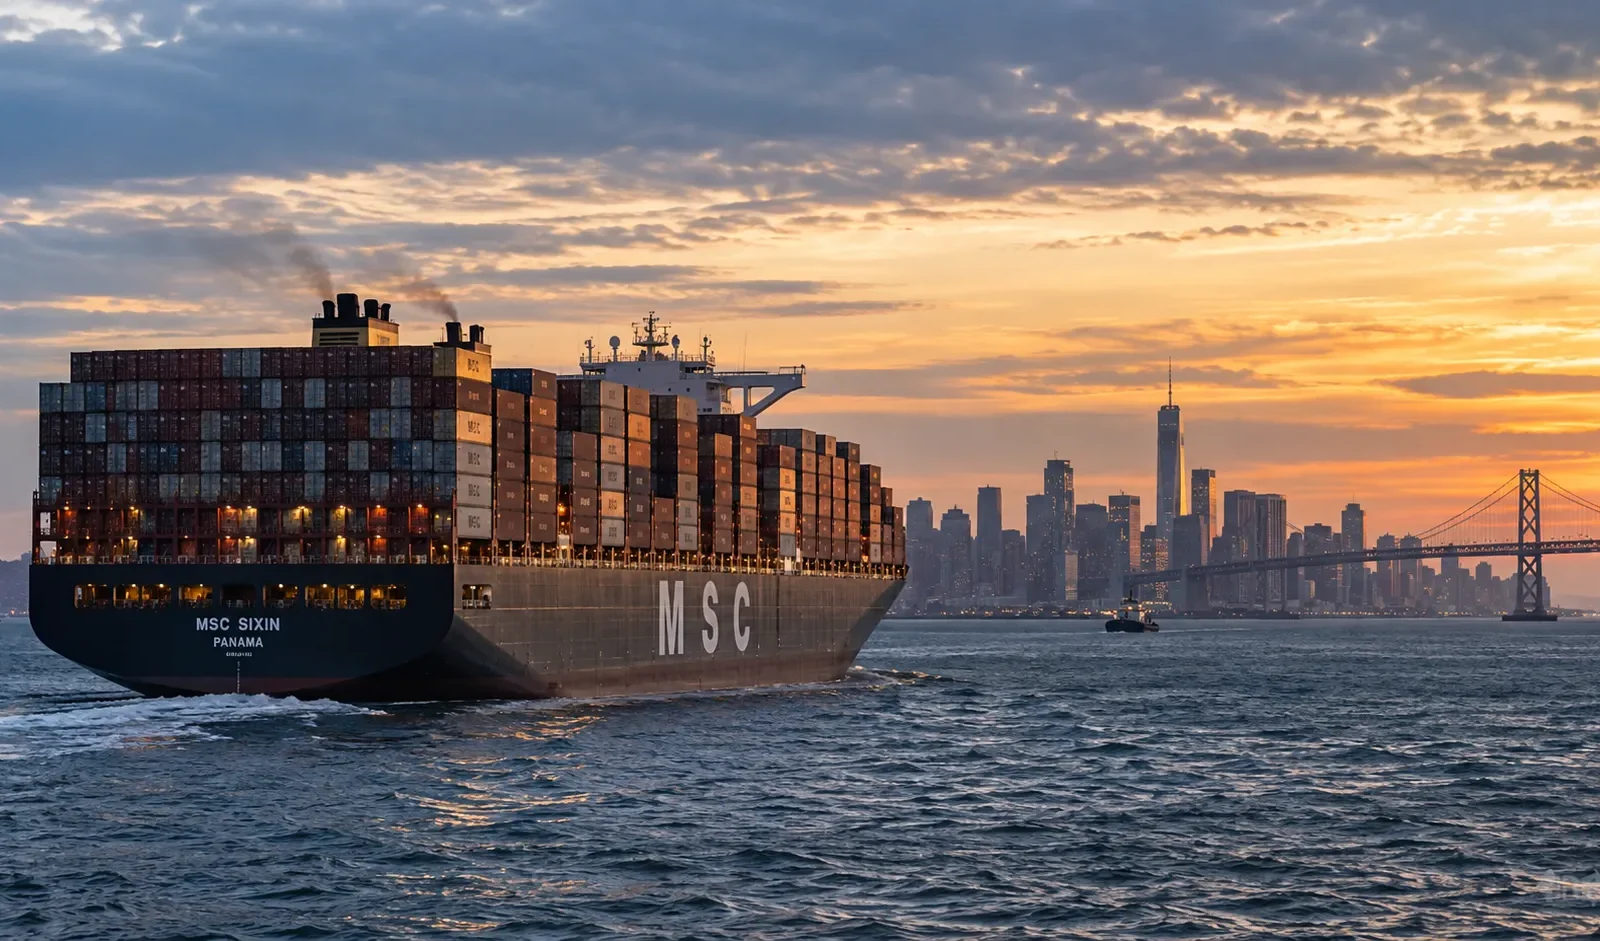
Transpacific container rates are again within striking distance of pandemic-era records. The Far East–US East Coast market has climbed above $11,000 per FEU, while West Coast rates are approaching $8,000 as carriers pass through higher fuel costs, manage capacity and prepare for another cargo push ahead of China’s Golden Week.
Xeneta assessed average Far East–US East Coast spot rates at $11,259 per FEU on 17 September 2026 — up 324.7% from 28 February and only 11.2% below its all-time COVID-era peak. Far East–US West Coast rates reached $7,960 per FEU, up 323.6% over the same period.
The move matters beyond liner shipping. US importers face higher landed costs, retailers must decide whether to advance bookings, carriers gain pricing power, and supply-chain teams are again confronting the possibility that a geopolitical shock in the Middle East can rapidly reprice container transport across the Pacific.
For Tide Signal’s broader route-by-route reference, see the live Container Shipping Rates 2026 hub. This analysis focuses specifically on the Transpacific spike and the mechanisms pushing Asia–US freight toward record territory.
Transpacific Container Rates: The Latest Numbers
Two widely used market datasets — Xeneta and Drewry — show the same direction, although their exact rate levels differ because the methodologies and market samples are not identical.
| Route | Xeneta market average, 17 Sep | Drewry, 17 Sep | Direction |
|---|---|---|---|
| Far East / Shanghai → US West Coast / Los Angeles | $7,960/FEU | $7,712/40ft | Strongly higher |
| Far East / Shanghai → US East Coast / New York | $11,259/FEU | $10,394/40ft | Strongly higher |
| Drewry global WCI | — | $4,500/40ft | +1% WoW |
Drewry reported its World Container Index rising 1% to $4,500 per 40ft container, driven mainly by the Transpacific. Shanghai–Los Angeles increased 5% week on week to $7,712, while Shanghai–New York rose 7% to $10,394.
Xeneta’s broader market-average assessments were higher, at $7,960 to the US West Coast and $11,259 to the US East Coast.
How Close Are Rates to the COVID-Era Record?
The comparison with the pandemic freight boom is no longer rhetorical.
Xeneta’s all-time Far East–US East Coast high was $12,683 per FEU, set on 1 January 2022. The 17 September 2026 market average of $11,259 is only 11.2% below that level.
On the West Coast, the current $7,960 rate is 17.9% below Xeneta’s all-time peak of $9,699 per FEU.
| Trade | 17 Sep 2026 | Historic peak | Gap to peak |
|---|---|---|---|
| Far East → US East Coast | $11,259 | $12,683 | 11.2% below |
| Far East → US West Coast | $7,960 | $9,699 | 17.9% below |
The historical context is important because the market structure is very different from 2021–22. The pandemic peak was driven by widespread port congestion, equipment shortages, consumer-goods demand and severe network disruption.
The 2026 surge is being driven by a different combination: geopolitical fuel shock, carrier surcharges, capacity management, seasonal booking pressure and uncertainty over how quickly supply chains can normalize.
Why the US East Coast Is More Expensive Than the West Coast
US East Coast rates have moved more aggressively because the route is longer and more fuel-intensive, particularly when normal network assumptions are disrupted.
Distance alone is not the full explanation. East Coast pricing also reflects:
- higher bunker exposure per voyage;
- different service networks and capacity deployment;
- canal and routing constraints;
- port and inland-market demand;
- carrier willingness to add or withdraw weekly slots;
- shipper urgency ahead of seasonal closures.
When bunker prices surge, the longer route naturally experiences a larger absolute cost shock. That helps explain why analysts see the US East Coast as the most likely route to challenge its historic record first.
Bunker Fuel Above $900/tonne Is Repricing the Voyage
Reuters reported global bunker fuel at around $901.50 per metric tonne during the September rate surge as oil markets responded to the Middle East conflict and attacks on critical energy infrastructure.
For a large containership, fuel is one of the largest variable voyage costs. A sharp increase therefore matters even before carriers add explicit emergency or fuel surcharges.
Higher bunker prices can affect liner economics through:
- higher main-engine fuel cost;
- higher auxiliary consumption cost;
- greater cost for longer East Coast routings;
- higher bunker-adjustment factors and emergency surcharges;
- pressure to optimize speed and network deployment.
Carriers including MSC, Maersk, COSCO and CMA CGM have been passing part of the fuel shock through to customers via surcharges, according to Reuters.
Golden Week Is Creating Another Short-Term Rate Push
China’s Golden Week creates a predictable annual shipping pattern: factories close, cargo owners accelerate shipments, and exporters try to secure vessel space before the holiday interruption.
In a balanced market, that seasonal effect can be manageable. In a market already stressed by high fuel costs and tight capacity, the same booking rush can amplify rates.
Xeneta expects another rate push around the start of October as shippers move cargo before the Golden Week shutdown.
The key question is what happens immediately after that surge.
Xeneta’s view is that rates could begin to soften — or at least rise more slowly — in the following weeks as the pre-holiday cargo wave passes and carriers increase capacity.
Carriers Are Adding Capacity — But Also Using Blank Sailings
The market is sending two apparently contradictory signals:
- carriers are adding capacity into the US East Coast trade;
- carriers are also using blank sailings to control weekly supply.
Both can be true.
Xeneta reported offered Far East–US East Coast capacity in September around 6–7% higher than in August. That suggests carriers are responding to extremely high rates by deploying more space where the revenue opportunity is strongest.
At the same time, Drewry reported nine blank sailings announced for the following week, up from eight in the current week.
A blank sailing removes a scheduled departure. If cargo demand remains high, cancelling a sailing reduces the number of available slots and can help carriers defend higher rates.
This is one of the most important signals to watch because rate sustainability depends on whether added capacity eventually overwhelms carrier attempts to keep the market tight.
Why Capacity Management Matters More Than Nominal Fleet Supply
Container shipping has a large global fleet, but freight rates are set by effective weekly capacity on a specific trade — not by the total number of ships in existence.
Effective capacity can be reduced by:
- blank sailings;
- longer voyage routing;
- port congestion;
- late vessel arrivals;
- speed changes;
- equipment imbalances;
- service restructuring.
A market can therefore experience strong rates even when global fleet supply is expanding, provided enough effective capacity is removed or absorbed by longer voyages and disruption.
Why $11,000 East Coast Freight Matters to US Importers
A $10,000–$11,000 ocean freight rate is not the final landed logistics cost.
Importers may still face:
- origin handling;
- destination terminal charges;
- fuel or emergency surcharges;
- customs and brokerage;
- inland drayage;
- rail or intermodal charges;
- detention and demurrage risk;
- inventory carrying costs.
For lower-value cargo, ocean freight at these levels can materially alter product economics. A company importing furniture, building materials, consumer goods or other bulky products may see transport cost become a significant share of the cargo value.
That can lead to:
- price increases;
- shipment delays;
- order consolidation;
- route switching;
- supplier changes;
- inventory reductions.
Could Shippers Shift More Cargo to the US West Coast?
The rate gap creates an obvious question.
If the Far East–US East Coast market is above $11,000 while West Coast freight is closer to $8,000, can importers save money by discharging in Los Angeles or Long Beach and moving cargo inland by rail?
Sometimes — but not automatically.
The correct comparison is:
West Coast ocean freight + inland rail/truck + transit-time risk versus East Coast ocean freight + shorter inland delivery.
For cargo destined for the eastern United States, the apparent ocean saving can disappear once intermodal cost is included.
Other considerations include:
- rail capacity;
- port congestion;
- warehouse location;
- inventory timing;
- contracted carrier networks;
- cargo urgency.
What the WCI Is Telling the Market
Drewry’s global World Container Index reached $4,500 per 40ft container on 17 September.
The global benchmark moved only 1% week on week even while Shanghai–New York increased 7%.
That divergence matters. It shows that the current freight shock is not uniform across every lane.
For example, Drewry reported:
- Shanghai → Los Angeles: $7,712, +5% WoW;
- Shanghai → New York: $10,394, +7% WoW;
- Shanghai → Genoa: $4,016, -5% WoW;
- Shanghai → Rotterdam: $3,626, -9% WoW.
So the correct headline is not “global container freight is exploding everywhere.” The stronger conclusion is that the Transpacific is dramatically outperforming Asia–Europe.
US Rates vs Europe: A Market Splitting in Two
This divergence is one of the most important features of the September market.
| Route | Drewry rate | Weekly move | Market signal |
|---|---|---|---|
| Shanghai → New York | $10,394 | +7% | Extreme strength |
| Shanghai → Los Angeles | $7,712 | +5% | Strong |
| Shanghai → Genoa | $4,016 | -5% | Softening |
| Shanghai → Rotterdam | $3,626 | -9% | Weakening |
That split tells shippers and investors that route-specific supply and demand matter more than the global index alone.
It also reinforces why Tide Signal maintains a broader container-rate hub alongside individual market analyses.
Can Transpacific Container Rates Break the Record?
Yes, but it is not inevitable.
The US East Coast is close enough to the historic peak that one more strong rate cycle could take the market into record territory.
Three factors would support a new high:
- Fuel remains expensive. Persistent bunker costs above historical norms support carrier surcharges and higher break-even rates.
- Golden Week creates another booking rush. Shippers may front-load cargo before factory closures.
- Capacity remains disciplined. Blank sailings or network disruption can keep weekly space tight.
Three factors could stop the market:
- Added carrier capacity. High rates attract more ships and slots.
- Post-Golden Week demand softens. Front-loaded cargo can leave a temporary demand gap.
- Fuel prices ease. Lower bunker costs reduce surcharge pressure.
Why the Market Could Turn Quickly After Golden Week
Extreme freight markets contain their own correction mechanism.
When spot rates rise above $10,000:
- carriers add capacity;
- shippers bring bookings forward;
- some cargo becomes uneconomic;
- some importers postpone or cancel shipments;
- alternative ports and routing options become more attractive.
Those reactions can weaken the market after the immediate shortage passes.
Xeneta’s observation that East Coast offered capacity is already 6–7% higher month on month is therefore critical. It suggests carriers are responding to the rate signal.
What This Means for Carriers
For liner companies, the current Transpacific environment is commercially favorable.
Higher spot rates improve voyage revenue and create more room to recover fuel costs. Strong markets also increase the value of available ship capacity and give carriers greater leverage in contract discussions.
But there is a strategic trade-off.
If carriers deploy too much capacity too quickly, they can destroy the same rate environment they are trying to monetize.
The strongest operators therefore balance:
- spot-market upside;
- service reliability;
- fuel cost;
- capacity deployment;
- customer contract relationships.
What This Means for Shippers
Shippers need to separate urgency from panic.
When rates are rising quickly, the instinct is to secure space at almost any price. That may be correct for time-sensitive cargo. It can be expensive for flexible cargo if the market softens immediately after Golden Week.
Procurement teams should compare:
- spot versus contract exposure;
- East Coast versus West Coast landed cost;
- carrier service reliability;
- transit time;
- surcharge structure;
- free-time conditions;
- inventory cost if cargo is delayed.
What to Watch in the Next Three Weeks
The Transpacific market is now sensitive enough that a small number of indicators can materially change the outlook.
- Xeneta Far East–US East Coast spot average. A move toward $12,683 would put the market at its historic peak.
- Drewry Shanghai–New York. Continued weekly gains would confirm the trend across another benchmark.
- Blank sailings. More cancellations would tighten capacity; fewer would signal normalization.
- Offered East Coast capacity. Continued carrier additions could cap rates.
- Bunker fuel. Fuel remains one of the key drivers of surcharges.
- Golden Week bookings. The size of the pre-holiday rush will determine the final September/early October push.
- Post-holiday demand. This is the most important test of whether the spike is sustainable.
Frequently Asked Questions
What are current Transpacific container rates?
Xeneta assessed Far East–US West Coast spot rates at $7,960 per FEU and Far East–US East Coast rates at $11,259 per FEU on 17 September 2026. Drewry assessed Shanghai–Los Angeles at $7,712 per 40ft container and Shanghai–New York at $10,394.
Why are Asia–US container rates rising?
The current rise reflects a combination of higher bunker costs, geopolitical disruption, pre-Golden Week demand, carrier surcharges and capacity management through blank sailings.
Are container rates back at COVID-era highs?
Not yet. Xeneta’s Far East–US East Coast market average is 11.2% below its all-time 2022 peak, while the West Coast is 17.9% below its record.
Why is the US East Coast more expensive than the West Coast?
The East Coast route generally has longer voyage distances and greater fuel exposure. Capacity, canal routing, inland demand and carrier network decisions also influence the difference.
What is the Drewry World Container Index?
The WCI is a widely followed weekly benchmark for container spot freight rates on major east–west trade lanes. It was assessed at $4,500 per 40ft container on 17 September 2026.
Could rates fall after Golden Week?
Yes. Front-loaded cargo can leave weaker demand after the holiday, while carriers are already adding capacity to the US East Coast. Xeneta expects the rate increase to slow or potentially reverse after another early-October push.
Key Takeaways
- Transpacific container rates have moved back toward pandemic-era records.
- Xeneta’s Far East–US East Coast spot average reached $11,259/FEU on 17 September.
- The East Coast market is only 11.2% below Xeneta’s all-time 2022 peak.
- Far East–US West Coast rates reached $7,960/FEU.
- Drewry assessed Shanghai–New York at $10,394 and Shanghai–Los Angeles at $7,712.
- The global WCI rose to $4,500, but Asia–Europe routes weakened while the Transpacific strengthened.
- Bunker fuel around $901.50/tonne has increased carrier cost and surcharge pressure.
- Carriers are simultaneously adding East Coast capacity and using blank sailings to manage the market.
- Golden Week could trigger one more rate push before the market begins to soften.
Sources and Further Reading
- Xeneta — Weekly Ocean Container Shipping Market Update, 18 September 2026
- Drewry — World Container Index, 17 September 2026
- Drewry Supply Chain Advisors — WCI Weekly Update
- Reuters — Ocean container shipping rates could test record highs as fuel spike drives rise, 17 September 2026
Editorial verification: Tide Signal reviewed Xeneta, Drewry and Reuters data available on 22 September 2026. Spot freight assessments can differ by provider methodology, shipment characteristics, contract terms and date of assessment.