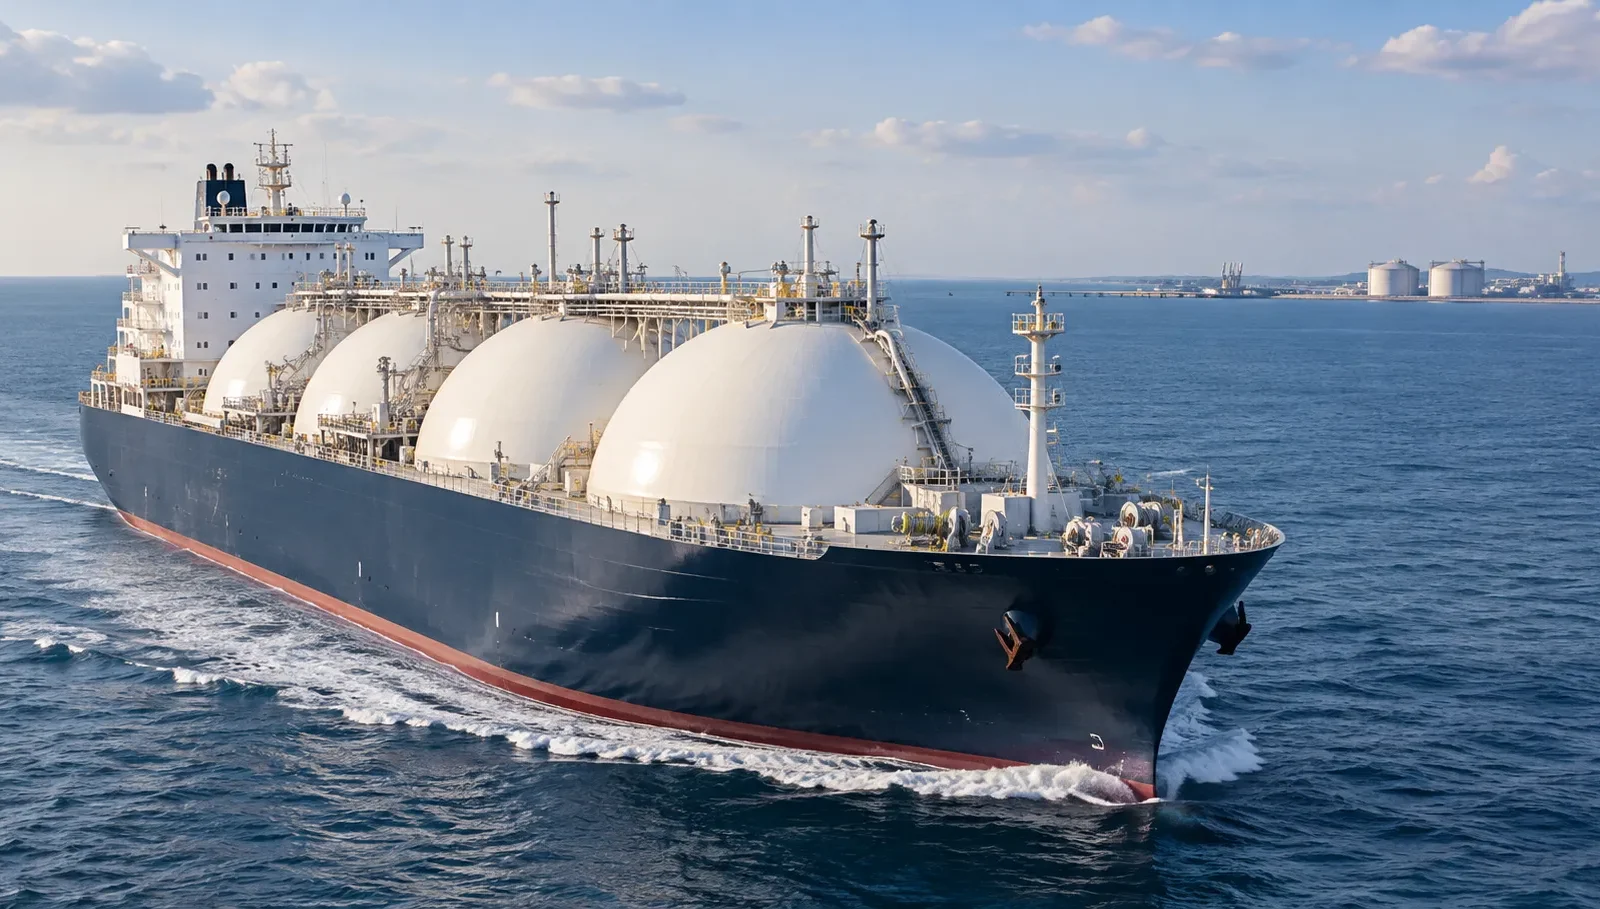
Atlantic LNG carrier rates are recovering as October cargo enquiries, winter gas demand and stronger US Gulf activity begin to tighten prompt vessel availability. Baltic Exchange assessments show the sharpest gains on US export routes, with US Gulf–Continent and US Gulf–Japan earnings rising strongly through late September. The rebound is significant — but the market still has enough available tonnage to prevent a full-scale freight squeeze.
Atlantic LNG Carrier Rates Are Finally Moving Higher
After months of weak freight and abundant vessel supply, the LNG carrier market has begun to show a clearer recovery.
The strongest improvement has emerged in the Atlantic Basin, where US Gulf export activity and new October cargo enquiries are giving owners more negotiating leverage.
According to the Baltic Exchange Gas Report for Week 39, all three major LNG freight benchmarks ended the week higher.
The US Gulf routes posted the largest gains.
| Route | Start of week | 25 September | Move |
|---|---|---|---|
| BLNG1 Australia–Japan | $28,050/day | $33,200/day | +$5,150/day |
| BLNG2 US Gulf–Continent | $24,700/day | $32,400/day | +$7,700/day |
| BLNG3 US Gulf–Japan | $51,900/day | $66,000/day | +$14,100/day |
The pattern is important.
BLNG3 — the long-haul US Gulf to Japan benchmark — produced the largest absolute gain.
That reflects one of the core principles of LNG shipping: distance matters.
October Cargo Enquiries Are Driving the Atlantic Recovery
Lloyd’s List reported on 25 September that October cargo enquiries had lifted Atlantic LNG carrier rates, with particular support coming from US Gulf and West African loadings.
Atlantic two-stroke LNG carrier rates were reported around $30,000 per day, approximately three times their late-August lows.
The recovery has developed gradually rather than through one sudden freight spike.
The Baltic’s weekly reports show the progression clearly.
| Week | BLNG2 US Gulf–Continent | BLNG3 US Gulf–Japan |
|---|---|---|
| 4 September | $17,000/day | $29,400/day |
| 11 September | $19,100/day | $37,600/day |
| 18 September | $23,900/day | $53,400/day |
| 25 September | $32,400/day | $66,000/day |
That trend shows a genuine improvement in Atlantic LNG freight.
But it does not mean the vessel market has become structurally tight.
The Market Is Recovering From an Extremely Weak Base
LNG carrier freight had been under severe pressure before the late-September rebound.
The basic problem was vessel supply.
A substantial number of LNG carriers were available relative to the volume of spot cargo demand.
At the same time, high gas prices had suppressed some Asian buying and shifted more cargo toward shorter Atlantic Basin voyages.
↓
Asian spot demand weakens
↓
More cargo stays in Atlantic
↓
Average voyage distance falls
↓
Fewer vessel-days required
That is why the LNG commodity market and the LNG shipping market can move in different directions.
Tide Signal’s LNG Prices 2026 analysis explains how gas prices could rise sharply while LNG carrier freight remained weak.
Why BLNG3 Is Rising Faster Than BLNG2
The difference between BLNG2 and BLNG3 illustrates tonne-mile economics.
BLNG2 represents US Gulf to Northwest Europe.
BLNG3 represents US Gulf to Japan.
A US Gulf–Japan voyage ties up an LNG carrier for much longer than a US Gulf–Europe voyage.
Longer voyages therefore absorb more vessel-days.
It cares how far those cargoes travel and how long each voyage keeps a vessel unavailable for the next fixture.
Tonne-Miles Are the Real LNG Freight Variable
Suppose two cargoes each contain the same volume of LNG.
One moves from the US Gulf to Europe.
The other moves from the US Gulf to Northeast Asia.
The second cargo may require the vessel for substantially longer.
That means:
- more sailing days;
- more fuel consumption;
- greater vessel utilisation;
- fewer prompt ships returning to the Atlantic;
- and potentially greater owner leverage.
For operators working through these economics, Tide Signal’s Voyage Estimation in Shipping explains how sailing distance, speed, fuel and port time affect commercial voyage results.
US LNG Exports Are Supporting the Atlantic Cargo Book
The United States remains one of the most important sources of flexible LNG supply in the world.
That flexibility becomes particularly important when regional shortages or geopolitical disruption alter traditional cargo flows.
US LNG cargoes can move toward:
- Northwest Europe;
- the Mediterranean;
- Northeast Asia;
- India;
- Latin America;
- and other premium markets.
The destination matters directly to shipping demand.
A cargo diverted from Europe to Asia may create far more vessel demand than the same cargo remaining inside the Atlantic Basin.
West African Loadings Are Adding Support
The Atlantic LNG market is not driven by the US Gulf alone.
West African production can also contribute meaningful cargo enquiries.
When US Gulf, West African and other Atlantic loadings overlap during the same fixing window, charterers compete for a smaller prompt vessel pool.
That is the mechanism behind the current improvement.
↓
More charterer enquiries
↓
Open vessel list begins to narrow
↓
Owners resist lower bids
↓
Freight rates rise
Winter Demand Is Beginning to Matter
The timing of the rebound is also important.
The market is approaching the Northern Hemisphere heating season.
Europe and Asia both need to manage winter gas supply risk.
That can increase competition for flexible LNG cargoes if temperatures fall or inventories prove inadequate.
The Baltic Exchange specifically cited seasonal demand expectations as one of the factors supporting stronger LNG freight sentiment in Week 39.
Europe and Asia Could Compete for the Same Cargoes
Europe and Northeast Asia sit on opposite sides of the LNG shipping equation.
When Asian prices are weak relative to Europe, US cargoes may remain in the Atlantic.
When Asian buyers pay a strong enough premium, those cargoes can travel much farther east.
That changes shipping demand even if total export volume does not move dramatically.
For LNG carriers, destination can therefore matter almost as much as production.
Why the Vessel Surplus Still Matters
The strongest argument against a sustained freight surge is straightforward: there are still a lot of ships.
Lloyd’s List cautions that vessel availability remains ample despite the latest rebound.
That means charterers may still have alternatives if rates move too aggressively.
A freight market becomes truly tight when charterers begin struggling to find suitable prompt ships.
The current market has improved, but it has not yet reached that condition across the board.
The latest rate gains are significant because they show improving vessel demand. But available tonnage remains large enough to limit owner pricing power if cargo enquiry weakens.
New LNG Carrier Deliveries Remain a Structural Headwind
The LNG shipping market is also absorbing a large newbuilding programme.
New deliveries increase the physical number of vessels available to carry cargo.
That creates a structural tension:
vs
More LNG carrier deliveries
↓
Which grows faster determines freight pressure
If liquefaction capacity and cargo demand grow faster than vessel supply, freight can strengthen.
If ships enter service faster than cargoes expand, utilisation falls and rates weaken.
That is one reason even a strong winter cargo market may not automatically produce the extreme LNG freight rates seen during previous tight cycles.
The Period Market Is Sending a Mixed Signal
Baltic period assessments also show that the market is not uniformly bullish.
At the end of Week 39:
- six-month LNG carrier assessment: $42,500/day;
- one-year assessment: $55,167/day;
- three-year assessment: $73,000/day.
The six-month rate softened while the longer one-year and three-year assessments increased.
That suggests participants remain cautious about the immediate vessel-surplus problem while retaining greater confidence in longer-term LNG shipping fundamentals.
Why Spot and Period LNG Rates Can Move Differently
Spot freight reflects the immediate balance between cargoes and available ships.
Period rates reflect expectations about the future.
A charterer may accept a stronger long-term rate if it expects:
- more LNG production;
- stronger winter demand;
- longer voyage distances;
- future vessel tightening;
- or greater geopolitical uncertainty.
The opposite can also occur.
That is why the current combination of stronger long-term assessments and a softer six-month number is worth watching.
Hormuz Remains an Important LNG Shipping Variable
Middle East disruption remains one of the largest uncertainties in global LNG trade.
Any meaningful improvement in Strait of Hormuz shipping conditions could allow more Gulf LNG supply to reach international markets.
That could affect freight in two competing ways.
First, additional cargoes could create more vessel demand.
Second, greater gas supply could lower commodity prices, potentially bringing price-sensitive buyers back into the market.
But if the additional supply is moved by vessels already dedicated to Middle East projects, the direct impact on the open spot carrier market may be smaller.
For current traffic and security conditions, see Tide Signal’s Strait of Hormuz live shipping-status hub.
Lower LNG Prices Could Actually Help Carrier Freight
This relationship can appear counterintuitive.
Very high LNG prices can destroy demand.
If Asian buyers reduce spot purchases because LNG becomes too expensive, fewer long-haul cargoes need ships.
Lower commodity prices can therefore sometimes support freight by bringing buyers back.
↓
Price-sensitive demand returns
↓
More cargoes are traded
↓
More vessels are required
↓
LNG freight can strengthen
Why China Matters
China is particularly important because it can generate large incremental LNG demand when prices become commercially attractive.
If Chinese spot buying recovers materially, more Atlantic cargoes may be pulled toward Asia.
That would increase tonne-mile demand and could tighten vessel availability much more rapidly than a similar increase in European buying.
India and Other Price-Sensitive Buyers Matter Too
India, Pakistan and other price-sensitive LNG markets can also materially affect shipping demand.
When spot LNG becomes too expensive, these buyers can reduce purchases.
When prices soften, demand can return.
The effect on freight can be amplified if replacement cargoes originate far from the importing market.
Pacific LNG Freight Is Also Improving
The Atlantic is currently attracting most of the attention, but the Pacific market has also strengthened.
BLNG1 Australia–Japan increased from $28,050/day to $33,200/day during Week 39.
The rise was smaller than the US Gulf routes but still confirms that the freight recovery is not purely Atlantic.
A sustained broader recovery would require both basins to absorb enough available vessels to reduce the global tonnage surplus.
Atlantic vs Pacific: The Current LNG Carrier Picture
| Market | Current signal | Main driver | Main risk |
|---|---|---|---|
| Atlantic | Strongest recovery | US Gulf + West Africa October enquiries | Large open tonnage list |
| Pacific | Improving | Seasonal demand and stronger activity | Vessel availability |
| Long-haul US–Asia | Strongest benchmark gain | High vessel-day consumption | Weak Asian spot demand |
| Period market | Mixed | Longer-term LNG growth expectations | Near-term oversupply |
What Would Turn the Recovery Into a Real Freight Rally?
Several developments could tighten the LNG carrier market further.
- More October and November cargo enquiries. A larger fixing programme would remove prompt vessels from the open list.
- Stronger Asian buying. More US Gulf–Asia cargoes would increase tonne-mile demand.
- Cold winter weather. Europe and Asia competing for cargoes could rapidly change the demand picture.
- Middle East supply recovery. More Gulf cargoes could increase total voyage activity.
- Operational delays. Canal congestion, weather or port delays can reduce effective vessel supply.
- Floating storage. Ships held with cargo onboard remain unavailable for new employment.
What Could Stop the Recovery?
The risks are just as important.
- October cargo enquiries could fade;
- Asian buyers could remain price-sensitive;
- mild winter weather could reduce gas demand;
- new carrier deliveries could expand vessel supply;
- more ships could ballast into the Atlantic;
- commodity prices could remain high enough to suppress spot demand;
- or shorter voyage patterns could reduce tonne-mile demand.
September’s rate recovery is meaningful because the Atlantic cargo book is finally consuming more prompt tonnage.
But the market is still carrying the legacy of a large vessel supply position.
The next stage depends less on whether LNG commodity prices remain high and more on whether enough cargoes travel far enough to keep ships occupied.
For LNG shipping, cargo volume matters. Voyage distance can matter even more.
What to Watch Next in LNG Carrier Rates
- BLNG2: can US Gulf–Continent hold above $30,000/day?
- BLNG3: does US Gulf–Japan continue outperforming shorter Atlantic routes?
- October cargo enquiries: does the fixing programme continue expanding?
- US LNG exports: are enough cargoes available to absorb prompt carriers?
- Asian spot buying: do China, India and other buyers return?
- European gas storage: does winter restocking support more cargo demand?
- Hormuz: do Middle East LNG flows begin normalising?
- Vessel availability: does the open tonnage list genuinely tighten?
- Newbuild deliveries: how quickly does additional carrier supply enter the market?
- Winter temperatures: cold weather could quickly reshape Europe–Asia cargo competition.
Atlantic LNG Carrier Rates FAQ
Are Atlantic LNG carrier rates rising?
Yes. Baltic Exchange assessments strengthened significantly in late September, particularly on US Gulf export routes.
What is the current BLNG2 rate?
The Baltic Exchange assessed the US Gulf–Continent BLNG2 route at $32,400/day on 25 September 2026.
What is the current BLNG3 rate?
The US Gulf–Japan BLNG3 benchmark closed at $66,000/day on 25 September 2026.
Why are LNG carrier rates recovering?
The recovery is being supported by stronger October cargo enquiries, US Gulf export activity, seasonal winter demand expectations and a gradually tighter prompt vessel list.
Why are US Gulf–Japan rates higher than US Gulf–Europe?
The Japan voyage is significantly longer, tying up the vessel for more time and creating greater tonne-mile demand.
Is the LNG carrier market now tight?
Not yet. Rates have improved, but industry reporting still describes vessel supply as ample. That surplus remains the main constraint on further freight gains.
Could winter demand push LNG carrier rates higher?
Yes. Stronger competition between Europe and Asia for LNG cargoes could increase vessel demand, particularly if more Atlantic cargoes travel to Asia.
- Baltic Exchange — Gas Report, Week 39, 25 September 2026
- Baltic Exchange — Gas Report, Week 38, 18 September 2026
- Baltic Exchange — Gas Report, Week 37, 11 September 2026
- Baltic Exchange — Gas Report, Week 36, 4 September 2026
- Lloyd’s List — Atlantic LNG carrier rates recover, but vessel surplus clouds outlook, 25 September 2026
Market note: LNG freight assessments can change daily as cargo enquiries, vessel positions, ballast movements, commodity prices, weather and geopolitical conditions evolve. Rates quoted above reflect Baltic Exchange assessments through 25 September 2026 and should be read as market benchmarks rather than guaranteed fixture levels.