Markets · Operations · Container Shipping
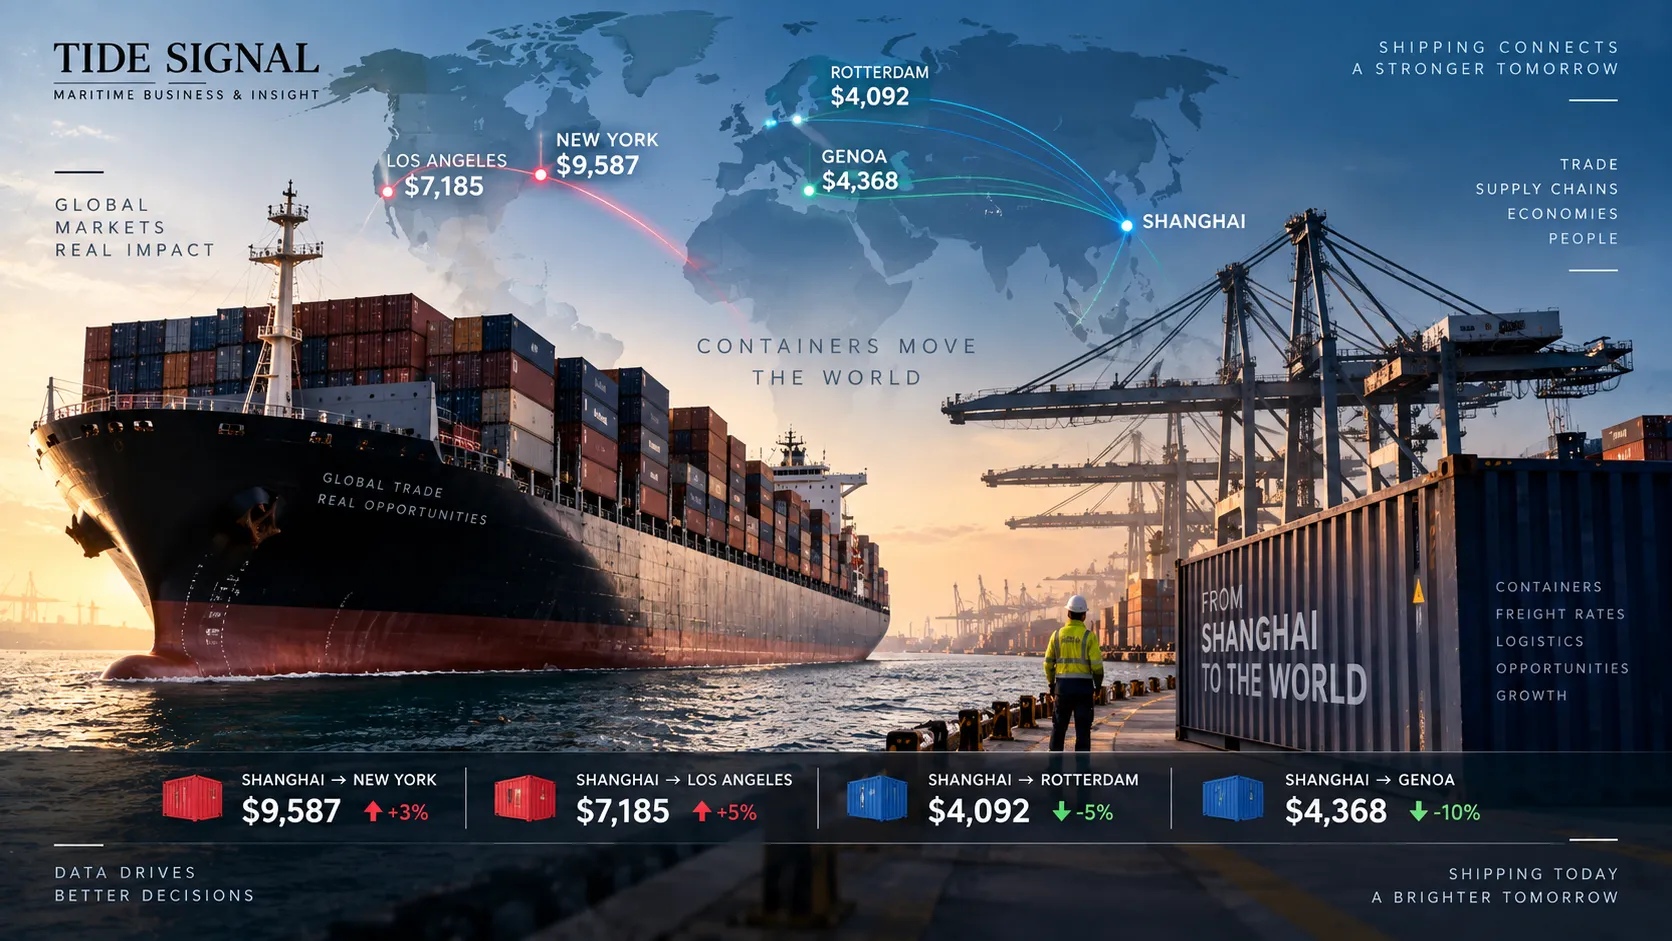
Container shipping rates in September 2026 now range from about $3,600 to more than $10,000 per 40ft container on major Shanghai routes. Drewry’s 17 September assessment puts Shanghai–New York at $10,394, Shanghai–Los Angeles at $7,712, Shanghai–Rotterdam at $3,626 and Shanghai–Genoa at $4,016. The divergence shows why there is no single “container shipping rate” — freight is priced by trade lane, available capacity and the commercial terms behind the shipment.
The supply-side context is covered in Tide Signal’s Transpacific Container Rates Near Record Highs as Asia–US Freight Surges Above.
How much does it cost to ship a 40ft container in 2026? On the major Shanghai routes tracked here, current benchmark ocean freight ranges from about $3,600 to $10,400 per 40ft dry container. The actual price depends heavily on destination, sailing date, equipment, carrier, available capacity, surcharges and whether the quote is port-to-port or door-to-door.
The Drewry World Container Index is quoted on a 40ft dry-container basis. Actual bookings may differ according to carrier, origin and destination charges, inland transport, equipment type, cargo, rate validity and commercial terms.
Current Container Shipping Rates 2026: Latest 40ft Prices by Route
The latest Drewry World Container Index shows a container market that looks relatively stable at global level but is moving sharply in opposite directions underneath the composite.
The global WCI composite stood at $4,500 per 40ft container in Drewry’s 17 September assessment, up 1% week on week. However, the price of moving the same standard container from Shanghai varied by almost $6,800 depending on destination.
| Route | Current 40ft rate | Weekly move | Market direction |
|---|---|---|---|
| Shanghai → New York | $10,394 | +7% | Higher |
| Shanghai → Los Angeles | $7,712 | +5% | Higher |
| Shanghai → Rotterdam | $3,626 | −9% | Lower |
| Shanghai → Genoa | $4,016 | −5% | Lower |
| Drewry WCI composite | $4,500 | +1% | Higher |
17 September market snapshot
The global index moved only 1%, but the route-level market moved much more aggressively. Shanghai–New York rose 7% and Shanghai–Los Angeles rose 5%, while Shanghai–Rotterdam fell 9% and Shanghai–Genoa fell 5%. Drewry described this as the seventh consecutive week of divergent Transpacific and Asia–Europe trends.
The practical message is simple: the $4,500 WCI composite is not a usable proxy for a specific shipment. Route selection, capacity management and regional disruption are currently producing very different freight outcomes.
The most important comparison is Shanghai–New York versus Shanghai–Rotterdam. The New York benchmark is approximately $6,768 higher for the same nominal container size.
That difference explains why a global average should never be treated as an actual shipping quotation. Container freight is bought on individual trade lanes, not at the global composite.
What Does a Container Shipping Rate Actually Mean?
The headline rate is not simply a carrier’s advertised base freight.
Under Drewry’s WCI methodology, the benchmark is based on agreed spot freight rates reported by freight forwarders and NVOCCs transacting with major liner carriers.
The index is expressed per FEU — one standard 40ft dry container — and represents Freight All Kinds cargo in standard equipment.
The basis is CY-to-CY, or container-yard to container-yard. Inland trucking is therefore outside the benchmark.
China to USA Container Shipping Cost
Current container shipping rates from China to the United States differ substantially between the West and East Coasts.
Shanghai to Los Angeles: $7,712 per 40ft
The Shanghai–Los Angeles benchmark increased 5% week on week to $7,712.
The West Coast has a shorter ocean leg from Asia than the US East Coast, but distance alone does not determine freight. Available weekly capacity, blank sailings, cargo demand, inland logistics and carrier pricing all influence the final market.
Shanghai to New York: $10,394 per 40ft
Shanghai–New York rose 7% to $10,394, pushing the route above the $10,000-per-FEU threshold.
The current New York benchmark is approximately 35% above Los Angeles.
Ten containers booked at these benchmark levels would create an ocean-freight difference of roughly $26,820 between the two routes before destination transport and other charges are considered.
That does not automatically make Los Angeles the cheaper total supply-chain option. Cargo ultimately destined for the US East Coast may require additional rail, trucking, handling and transit time if discharged on the West Coast.
Commercial takeaway
The correct comparison is total landed logistics cost and reliability — not ocean freight alone.
China to Europe Container Shipping Cost
Current China-to-Europe container rates are moving in the opposite direction to the Transpacific.
Shanghai to Rotterdam: $3,626 per 40ft
The benchmark fell 9% during the week to $3,626.
Shanghai to Genoa: $4,016 per 40ft
Shanghai–Genoa fell 5% to $4,016.
The decline reflects a combination of softer demand and more effective capacity available on Asia–Europe services.
The result is a striking market split: Shanghai–New York is above $10,000 while Shanghai–Rotterdam has fallen below $3,700.
Why Are US Container Rates Rising While Europe Is Falling?
The central issue is available weekly capacity relative to cargo demand.
This is different from simply counting the number of containerships in the world fleet.
If carriers remove sailings from a trade while cargo volumes remain resilient, the remaining services operate with fewer available slots. That can strengthen utilisation and pricing power.
If carriers add effective capacity while demand weakens, the opposite pressure develops.
↓
Vessel utilisation
↓
Carrier pricing power
↓
Container spot freight
Drewry’s 17 September assessment showed continued capacity management on the Transpacific ahead of China’s Golden Week, while Asia–Europe remained under pressure from weak demand and the gradual return of services through the Suez Canal.
The supply-side context is covered in Tide Signal’s Shipping Week Ahead: Suez Return, $11,000 Container Rates and Hormuz Risk.
How Port Congestion Changes Container Shipping Rates
Port congestion can tighten container markets even without removing a single vessel from the physical fleet.
The reason is effective capacity. A ship delayed at several ports takes longer to complete its round voyage. That means the same vessel provides fewer usable slots over a given period.
Tide Signal’s Asia Port Congestion 2026 analysis explains how delays absorb effective capacity even when the physical fleet is unchanged. In Drewry’s 17 September assessment, average vessel waiting time at Shanghai increased from 65 hours in Week 36 to 78 hours in Week 37.
The effect matters commercially because longer port stays extend vessel rotations, reduce schedule recovery opportunities and can remove usable weekly slots from the market without removing a single ship from the fleet.
For a broader explanation of how waiting time turns into commercial exposure, see Port Delays: When Waiting Time Becomes Commercial Risk.
Why effective capacity matters
A containership at anchor is still counted in the global fleet. But until it resumes its rotation, it is not producing the same weekly transport capacity as a vessel operating on schedule.
Why Blank Sailings Can Push Container Rates Higher
A blank sailing is a scheduled voyage that the carrier cancels.
If cargo demand remains unchanged while a weekly sailing disappears, fewer slots remain available to transport the same cargo volume.
That can increase utilisation on the remaining vessels and strengthen carrier pricing power.
This is why blank sailings are a critical variable when interpreting container shipping rates. They are not simply an operational scheduling issue — they actively change effective market supply.
18 September capacity signal
Drewry’s latest Cancelled Sailings Tracker expects 77 blank sailings from Week 39 to Week 43 across 720 planned East–West sailings, an 11% cancellation rate. About 55% of the announced cancellations are concentrated on the Transpacific eastbound trade, compared with 31% on Asia–North Europe/Med and 14% on the Transatlantic.
How Suez Routing Changes Effective Container Capacity
Voyage distance also changes the amount of fleet capacity required to maintain a weekly liner service.
A ship diverted around the Cape of Good Hope remains occupied for longer than the same vessel transiting the Suez Canal. More sea days mean more ships are required to preserve the same weekly frequency.
If services return to the shorter Suez routing, voyage duration falls and capacity can effectively return to the market without any additional ship being delivered.
That principle is central to current container-market economics: physical fleet size and commercially usable capacity are not the same thing.
For broader route-risk context, Tide Signal’s Maritime Chokepoints Explained covers Suez, Hormuz and Malacca and how disruption at major maritime nodes changes voyage planning and trade flows.
Do Higher Bunker Prices Increase Container Shipping Rates?
Fuel is one of the largest variable operating costs in ocean shipping. Higher bunker prices therefore increase the cost base behind each voyage.
However, bunker costs do not translate one-for-one into higher spot container freight. Carrier pricing still depends on demand, vessel utilisation, deployed capacity and the competitive market.
Fuel-cost pressure is rising again
Reuters reported on 17 September that global bunker fuel prices had risen to around $901.50 per metric tonne amid Middle East energy disruption. That does not mechanically set container freight, but it raises the voyage-cost base carriers must recover through freight, bunker adjustments and other surcharges.
For the wider Gulf operating picture, see Tide Signal’s Strait of Hormuz live shipping status.
Tide Signal’s Bunker Fuel Shortage 2026 analysis tracks the latest VLSFO supply squeeze and the way higher marine-fuel prices feed into voyage economics.
For the operational side of fuel procurement, delivery, sampling and documentation, see the Bunkering Operations guide.
What Is Included in a Container Shipping Rate?
This is one of the most important distinctions for anyone comparing container freight prices online.
Drewry defines its WCI as total ocean freight for standard dry containers and includes several common carrier surcharges where applicable.
These can include:
- bunker adjustment factors;
- emergency bunker adjustments;
- currency adjustment factors;
- peak-season surcharges;
- equipment-related surcharges;
- port additional charges and dues;
- emergency-risk surcharges;
- carrier and port security charges;
- Suez Canal surcharges;
- Panama Canal surcharges;
- Gulf of Aden surcharges;
- port-congestion surcharges;
- EU ETS surcharges where applicable.
Terminal handling charges may be included or excluded depending on normal market practice for the route.
That makes the WCI more comprehensive than a bare base-freight quotation, but it still does not represent a complete door-to-door shipment cost.
What Is Not Included in the Drewry Container Rate?
The WCI specifically excludes inland transportation.
An actual importer may also incur:
- origin trucking;
- destination trucking or rail;
- documentation charges;
- bill-of-lading fees;
- booking fees;
- customs-clearance fees;
- duties and taxes;
- cargo insurance;
- storage;
- demurrage and detention;
- special-equipment charges;
- other terminal or destination-specific expenses.
A $7,712 Shanghai–Los Angeles benchmark should therefore not be treated as a $7,712 factory-to-warehouse budget.
Ocean Freight vs Door-to-Door Shipping Cost
| Cost layer | Included in WCI headline? |
|---|---|
| Ocean freight | Yes |
| Common applicable carrier surcharges | Generally included under the methodology |
| Origin trucking | No |
| Destination trucking / rail | No |
| Customs clearance | No |
| Duties / taxes | No |
| Separate demurrage / detention exposure | No |
This is the fundamental difference between an ocean-freight benchmark and total landed logistics cost.
20ft vs 40ft Container Shipping Cost: Is a 20ft Half the Price?
No.
Drewry’s headline WCI figures are reported per FEU, meaning a standard 40ft container.
A 20ft container represents one TEU, but commercial freight pricing does not operate on a fixed 1:2 relationship.
The actual 20ft rate depends on:
- equipment availability;
- trade imbalance;
- cargo weight;
- carrier pricing;
- repositioning economics;
- available ship slots;
- origin and destination.
The safe approach is to use WCI data to understand the direction of the 40ft market and obtain a separate route-specific 20ft quotation where needed.
What About Reefer Containers, Flat Racks and Open Tops?
The standard container rates on this page should not be used as pricing benchmarks for specialised equipment.
Drewry’s WCI methodology relates to standard dry containers carrying Freight All Kinds cargo.
It does not represent:
- reefers;
- flat racks;
- open tops;
- tank containers;
- out-of-gauge cargo;
- other specialised equipment.
Reefer freight can be materially higher because refrigerated boxes require more expensive equipment, electrical power, monitoring and limited plug availability.
How to Compare Container Freight Quotes Properly
The cheapest headline freight rate is not necessarily the cheapest shipment.
A proper comparison should place each quotation on the same commercial basis.
Check:
- origin and destination basis — CY/CY, port/port or door/door;
- container type — 20GP, 40GP, 40HC, reefer or specialised equipment;
- base freight;
- included surcharges;
- origin charges;
- destination charges;
- documentation fees;
- customs charges;
- free time;
- demurrage and detention terms;
- transit time;
- direct vs transshipment service;
- rate validity;
- space guarantee;
- equipment guarantee.
Why a Larger Global Fleet Does Not Automatically Mean Lower Rates
A large physical fleet can coexist with elevated freight rates because freight is ultimately priced against usable capacity on a particular trade.
Effective capacity can be absorbed by:
- port congestion;
- longer Cape routings;
- weather delays;
- canal restrictions;
- blank sailings;
- schedule recovery;
- equipment imbalance;
- regional cargo surges.
This is why nominal fleet growth does not automatically translate into cheaper freight.
Will Container Shipping Rates Rise or Fall Next?
The current outlook remains sharply split by trade. Drewry’s 17 September assessment expects slight Transpacific increases into the pre-Golden Week period while Asia–Europe remains under mild downward pressure.
The global WCI can therefore remain comparatively stable while major routes move sharply in opposite directions.
The variables Tide Signal is watching most closely are:
- Transpacific blank sailings and available weekly slots;
- Asia–Europe capacity as routing patterns change;
- Asian port congestion and schedule reliability;
- Suez routing and effective vessel supply;
- bunker prices and carrier operating costs;
- US import demand;
- geopolitical and canal disruption.
Container Shipping Rates: Why the Global Average Is Not Enough
The Drewry WCI composite of $4,500 is useful because it gives the market a common global benchmark.
But no shipper actually books “the global average”.
A Shanghai–New York customer is looking at approximately $10,394.
A Shanghai–Rotterdam customer is looking at approximately $3,626.
The difference reflects two separate freight markets with different demand, capacity and carrier-management conditions.
Bottom line
Container shipping rates should always be read route by route. A useful benchmark tells you where the freight market is trading. A commercial quotation tells you what your actual shipment will cost. The two should never be confused.
Container Shipping Rates 2026: Frequently Asked Questions
How much does it cost to ship a 40ft container in 2026?
On the major Shanghai routes covered by Drewry’s 17 September assessment, benchmark rates range from approximately $3,626 to $10,394 per 40ft dry container. Actual quotations vary by route, carrier, equipment, sailing date and commercial terms.
What are current container shipping rates from China to the USA?
The latest Drewry benchmarks used on this page are $7,712 per 40ft container from Shanghai to Los Angeles and $10,394 from Shanghai to New York.
How much does it cost to ship a container from China to Europe?
Current benchmarks are approximately $3,626 per 40ft container from Shanghai to Rotterdam and $4,016 from Shanghai to Genoa.
What is the current Drewry World Container Index?
The Drewry World Container Index composite stood at $4,500 per 40ft container in the 17 September 2026 assessment used for this update.
Does a container shipping rate include trucking?
Not in the Drewry WCI. The benchmark is CY-to-CY and excludes inland transportation.
Are customs duties included in container freight rates?
No. Customs duties, taxes and customs-clearance costs are separate from the ocean-freight benchmark.
Is a 20ft container half the price of a 40ft container?
Not necessarily. Container pricing does not follow a fixed 1:2 relationship. Equipment availability, cargo weight, route balance and carrier pricing all affect the actual 20ft quotation.
Why is Shanghai to New York more expensive than Shanghai to Rotterdam?
The two trades currently have different supply-demand and capacity conditions. Transpacific capacity management is supporting higher rates, while Asia–Europe is facing greater capacity availability and softer demand.
Can port congestion increase container freight rates?
Yes. Severe congestion can lengthen vessel rotations and reduce effective weekly capacity. Whether that translates into higher freight depends on cargo demand and available supply on the affected trade.
Can higher bunker prices increase container rates?
Higher fuel prices increase carrier operating costs, but the ability to pass those costs into freight depends on utilisation, competition, trade demand and carrier pricing power.
What is the Drewry World Container Index?
The WCI is a weekly benchmark covering agreed spot freight rates on major East–West container trades. It is reported in US dollars per standard 40ft dry container.
How often is this page updated?
Tide Signal treats this as a living container-rates page and updates the same URL when new Drewry assessments materially change current freight prices or the market outlook.
Related Tide Signal Analysis
- Asia Port Congestion 2026 — how deteriorating schedule reliability can absorb effective container capacity.
- Port Delays: When Waiting Time Becomes Commercial Risk — why vessel delay becomes a capacity and cost issue.
- Bunker Fuel Shortage 2026 — current VLSFO pressure and the impact of marine-fuel costs on shipping economics.
- Bunkering Operations — fuel planning, procurement, delivery, documentation and operational control.
- Maritime Chokepoints Explained — how Suez, Hormuz and Malacca disruption can change available vessel capacity and global trade flows.
- War Risk Premiums in Shipping — how geopolitical risk moves into routing, insurance and voyage costs.
- Voyage Estimation in Shipping — the wider commercial relationship between freight, bunkers, voyage time and profitability.
- Pinglu Canal and China–ASEAN Shipping — how new inland-to-sea infrastructure can reshape regional routing, distance and logistics options.
- Drewry — World Container Index — current route benchmarks and global composite.
- Drewry — World Container Index Methodology — methodology, commercial basis and index coverage.
- Drewry — Latest Container Shipping Trackers and Indices .
- Drewry — Cancelled Sailings Tracker, 18 September 2026 — current East–West blank-sailing and capacity-management data.
- Reuters — container freight and bunker-cost pressure, 17 September 2026 — independent market context on fuel-cost escalation and China–US spot-rate pressure.
Last page update: 18 September 2026. Rate data: Drewry assessment dated 17 September 2026. Freight figures are market benchmarks rather than guaranteed carrier quotations. Actual costs vary according to route, carrier, equipment, cargo, rate validity, surcharges, free time, terminal charges, customs requirements and inland transportation.